
With the current initiatives to eliminate methane emissions, the practice of using natural gas to operate wellsite pneumatic controls has come under scrutiny. A popular remedy is the use of instrument air compressors to replace the natural gas used in these devices. The problem with these compressors is reliability, and few operators have incorporated monitoring instrument air systems with their Scada systems. Most only receive notice of low instrument air pressure, but by then their entire facility is shut down.
A simple low cost system trends instrument air use without the need of metering, while also trending air compressor output and runtime for either single or dual instrument air compressor packages. Receive early notice of compressor performance issues and air leaks via Scada, which are provided by onboard analytics of pressure data.
A simple low cost system trends instrument air use without the need of metering, while also trending air compressor output and runtime for either single or dual instrument air compressor packages. Receive early notice of compressor performance issues and air leaks via Scada, which are provided by onboard analytics of pressure data.
|
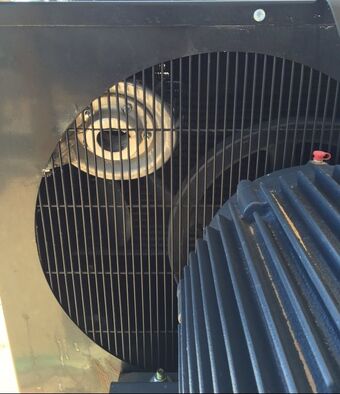
Additionally, traditional air compressor shutdown lights can become inputs to the Pneumatic System Monitor, allowing for Scada reporting. A high discharge temperature shutdown is what happened to the screw compressor package pictured. The cooling fan detached from the motor shaft, flinging it into the air cooling tube bundle.
|
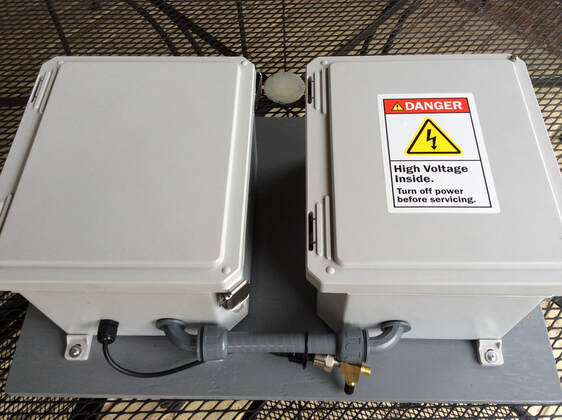
The Pneumatic System Monitor can be fitted to most any commercial instrument air package.
Example of pressure analytics
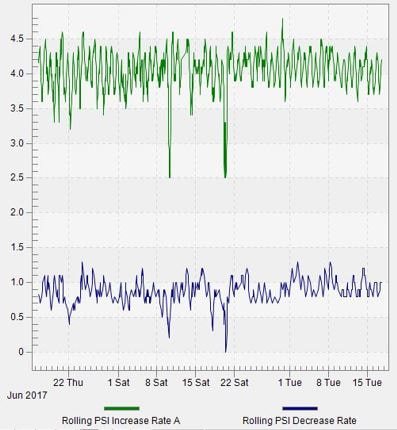
Rolling Pressure Decrease: The blue curve to the right is two months of the measured pressure decrease rate while the air compressor was not running. This shows a very stable instrument air requirement.
Rolling Pressure Increase: The green curve is the pressure increase rate while the air compressor was running added to the Pressure Decrease curve (which accounts for changes in instrument air demand). This shows the air compressor output is stable.
Rolling Pressure Increase: The green curve is the pressure increase rate while the air compressor was running added to the Pressure Decrease curve (which accounts for changes in instrument air demand). This shows the air compressor output is stable.
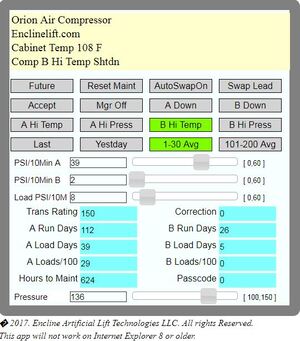
Smartphone Monitoring
|
|